CXM vs EXM: Two Sides of the Same Experience System
Learn how Customer Experience Management differs from Employee Experience Management and why customer and employee experience can
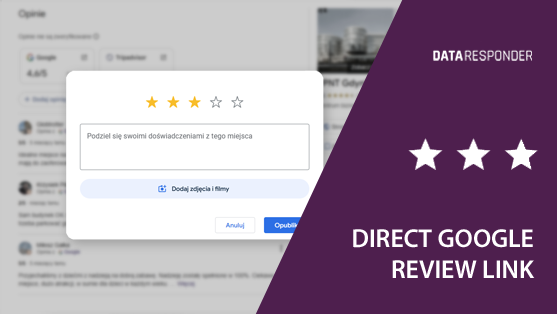
How to Create a Direct Google Review Link
Learn how to find your Google Business Place ID and generate a direct link that takes customers
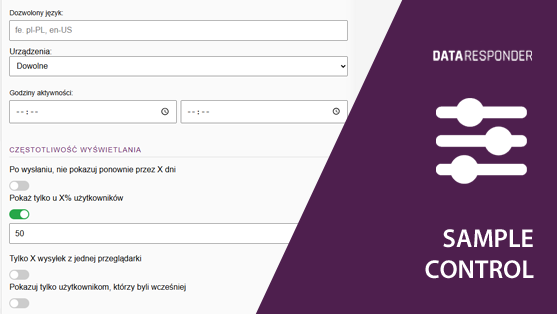
How to Control the Research Sample in Feedback Forms
Learn how to limit the research sample in web feedback forms to avoid survey fatigue, improve data
Turning CX Insights into Real Improvements
Learn why CX insights without execution don’t improve quality and how to turn feedback findings into real
Why CXM Is More Than Customer Feedback
Learn what Customer Experience Management (CXM) really is, how it works in practice, and how it turns
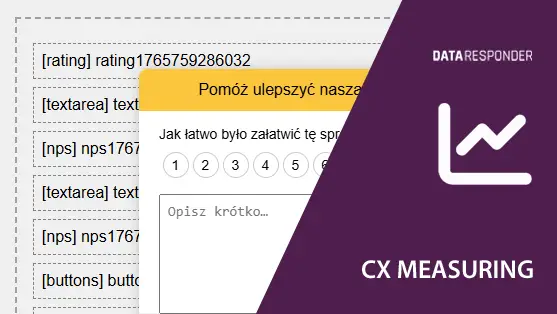
Measuring Customer Experience with CSAT, CES, and NPS
Learn how CSAT, CES, and NPS differ, when to use each metric, and how to measure customer
Linking Experience Quality to Business KPIs
Learn how to link experience quality with business KPIs, why correlations aren’t always immediate, and why long-term
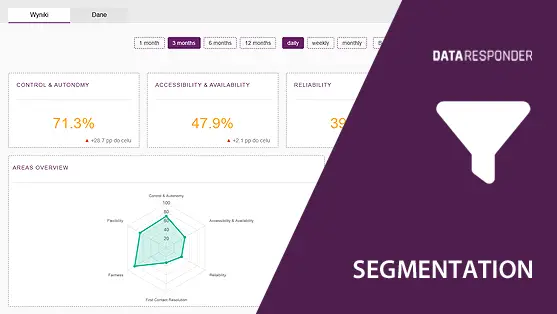
Segmentation as a Prerequisite for Meaningful Insights
See why averages often mislead in customer feedback and how segmentation reveals real experience problems that drive
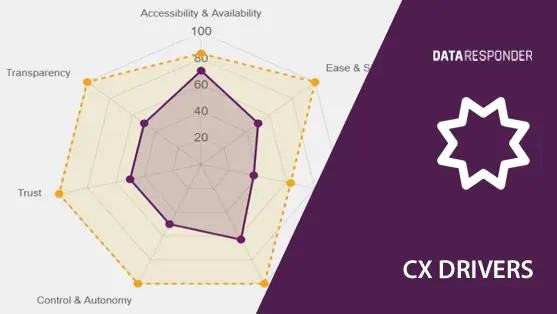
CX Drivers: What Really Shapes Customer Evaluations
Learn what CX drivers are, what they are not, and why they explain customer ratings and turn
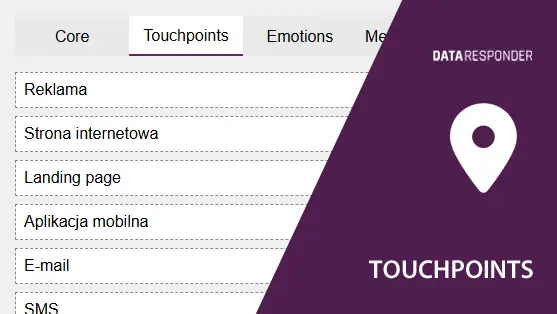
Touchpoints as Decision Moments
Learn what a touchpoint really is, why it’s a decision moment—not a survey slot—and where, when, and
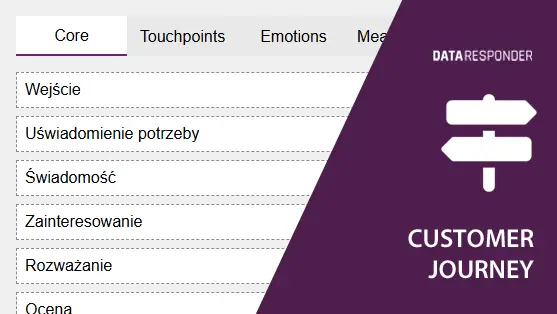
What Is Customer Journey and How to Use It in Practice
Learn what Customer Journey is – and what it is not – and how to use it

Operational vs Strategic Feedback
Learn the difference between operational and strategic feedback – and why collecting feedback alone doesn’t improve customer