Measuring customer experience: why measure and what are we really measuring?
Measuring customer experience and opinions only makes sense if it helps answer two key questions:
- what works and what doesn’t at specific touchpoints,
- what to improve to change customer behavior (return, purchase, recommendation, fewer complaints).
In practice, three simple metrics are used most often: CSAT, CES, and NPS. Each serves a different purpose and comes with different pitfalls.
CSAT – satisfaction with a specific experience
CSAT (Customer Satisfaction Score) measures satisfaction with a specific interaction or stage. It is usually a simple question such as:
- “How satisfied are you with…?”
answered on a scale (e.g. 1–5 or 1–10).
When CSAT makes sense:
- after a completed service or visit,
- after a contact with customer support,
- after delivery, order fulfillment, a session or appointment,
- when you want to compare quality across locations or teams.
Examples of CSAT questions:
- “How would you rate today’s visit?”
- “How satisfied are you with the service?”
- “How would you rate the quality of the service you received today?”
The CSAT trap: CSAT is highly sensitive to context and expectations. The same service can receive different ratings depending on price, time of day, workload, or customer mood. Without segmentation, CSAT easily turns into a random average.
CES – customer effort: was it easy or exhausting?
CES (Customer Effort Score) measures how much effort the customer had to invest to get something done. Questions usually focus on ease or difficulty:
- “How easy was it to…?”
- “How much effort did it take to…?”
When CES delivers the most value:
- in post-purchase support and service (complaints, returns, issues),
- in processes where flow matters (registration, onboarding, payment),
- where customers abandon processes (forms, sign-ups, checkout).
Examples of CES questions:
- “How easy was it to resolve your issue?”
- “How much effort did it take to book an appointment?”
- “How easy was it to find the information you needed?”
Why CES can be more powerful than CSAT: effort strongly drives frustration and churn. A customer may be “reasonably satisfied”, but if something was exhausting, they are likely to choose a competitor next time.
NPS – willingness to recommend, not “here-and-now quality”
NPS (Net Promoter Score) measures declared willingness to recommend:
- “How likely are you to recommend us to a friend or colleague?” (0–10)
NPS is popular – but often misused.
When NPS makes sense:
- when measuring the long-term relationship with the brand,
- when the customer has accumulated enough experience,
- when you need a strategic, trend-based metric over time.
NPS pitfalls:
- it is not a single-touchpoint metric (it is too broad),
- it is sensitive to industry, pricing, and expectations,
- on its own, NPS does not tell you what to improve – you need drivers and follow-up questions.
This is why NPS without context and “why” questions often ends up as a number for reporting only.
How to choose the right metric? Simple criteria
Instead of choosing the most popular metric, choose the one that fits your goal and the moment in the Customer Journey.
Choose CSAT if:
- you want to evaluate the quality of a specific service or visit,
- you need to compare touchpoints, locations, or teams,
- you want to quickly detect quality drops.
Choose CES if:
- the problem is abandonment, complaints, frustration, or friction,
- customers say “it was exhausting” or “too many steps”,
- you want to improve processes, not just impressions.
Choose NPS if:
- you measure long-term relationships and loyalty,
- the customer has a history of interactions with your company,
- you need a stable, trend-oriented metric.
In a mature approach, these metrics do not compete – they complement each other.
Example: how this can work in practice (café / club / service)
Assume a simple Customer Journey: visit → service delivery → completion → relationship.
You might apply:
- CSAT after the visit (overall satisfaction with the experience),
- CES after a support interaction or problem resolution (how much effort it took),
- NPS periodically (e.g. every 30–90 days) for returning customers to track loyalty trends.
For each metric, it is worth adding a short open-ended question:
- “What influenced your rating the most?”
This shortens the path from score to action.
How does Data Responder support this?
Data Responder embeds measurement in context, which is critical for meaningful metrics:
- you assign measurements to a specific touchpoint in the Customer Journey,
- you collect feedback through multiple channels (forms, QR codes, terminals),
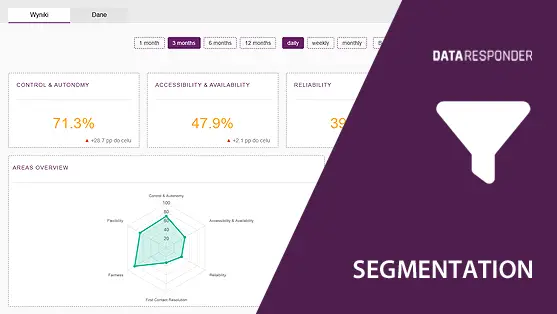
- you segment results (time, location, channel, additional parameters),
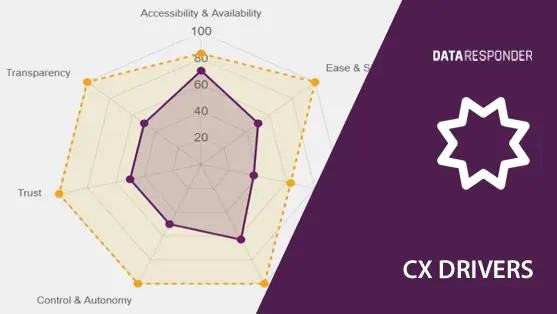
- you link metrics with CX drivers to understand why the result looks the way it does.
This ensures CSAT, CES, and NPS are not “surveys for surveys’ sake”, but elements of a measurement and decision framework.
Conclusions
CSAT, CES, and NPS are simple metrics, but each measures something different:
- CSAT – satisfaction with a specific experience,
- CES – effort and friction in a process,
- NPS – long-term relationship and willingness to recommend.
If you want these metrics to drive action:
- match the metric to the goal and touchpoint,
- add context (time, location, channel),
- do not rely on averages alone – segment your data,
- link results to drivers to understand the “why”.
Then customer experience measurement stops being “opinion collection” and becomes a tool for quality improvement.